Understanding defect rates in China manufacturing helps you set realistic expectations, evaluate suppliers like Alibaba, and benchmark your quality performance. While “zero defects” is the goal, some defect rate is inevitable in mass production. This 2026 guide provides industry defect rate benchmarks, explains factors affecting defect rates, and shows how to use defect data for supplier management and quality improvement.
📌 Key Takeaways
- Industry average: 2-5% overall defect rate for consumer goods manufacturing in China
- Best performers: Under 1% defect rate with mature quality systems
- Product variation: Electronics 3-8%, textiles 2-5%, simple goods 1-3%
- Key factors: Product complexity, supplier quality systems, order size, and price pressure
- Improvement: Defect rates should decrease over time with proper quality management
What is Defect Rate?
Definition and Calculation
Defect rate is the percentage of units with defects relative to total units produced or inspected. Formula: Defect Rate = (Defective Units ÷ Total Units) × 100. Example: 50 defects found in 1,000 units inspected = 5% defect rate. Defect rate can be calculated for: overall defects (any defect type), specific defect categories (major, minor, critical), or specific defect types (cosmetic, functional, dimensional). Understanding which calculation is being used is important for accurate interpretation.
Defect Rate vs. Defects Per Unit
Defect rate measures percentage of units with defects. Defects per unit (DPU) measures average defects per unit, which can exceed 1 if units have multiple defects. Example: 100 units inspected, 150 total defects found. Defect rate: 80% (80 units have at least one defect). DPU: 1.5 (average 1.5 defects per unit). Both metrics are useful: defect rate for customer impact (what percentage of customers get defective product), DPU for process quality (how many defects to fix).
AQL and Defect Rate
AQL (Acceptable Quality Level) defines acceptable defect rate for batch acceptance, not target defect rate. AQL 2.5 means you’ll accept batches with up to approximately 2.5% defect rate—but your target should be lower. AQL is the threshold for acceptance/rejection, not the expected or acceptable ongoing defect rate. A good supplier should consistently perform better than the AQL threshold.
Industry Defect Rate Benchmarks
Overall Manufacturing Benchmarks
| Performance Level | Defect Rate | Description |
|---|---|---|
| World-class | Under 0.5% | Six Sigma quality, exceptional processes |
| Excellent | 0.5-1% | Strong quality systems, continuous improvement |
| Good | 1-2% | Professional manufacturing, adequate QC |
| Average | 2-5% | Typical for general manufacturing |
| Below average | 5-10% | Quality issues, improvement needed |
| Poor | Over 10% | Serious quality problems |
Defect Rates by Product Category
Different product types have different typical defect rates. Electronics: 3-8% typical, due to component complexity and assembly precision requirements. Textiles and apparel: 2-5% typical, from stitching errors, fabric defects, sizing variations. Plastic injection molding: 1-3% typical, from flash, sink marks, dimensional issues. Metal fabrication: 2-4% typical, from finishing, dimensional tolerance. Simple assembly: 1-2% typical, lower complexity. Complex mechanical: 3-6% typical, more failure points. These are ranges—actual rates vary by specific product and supplier quality.

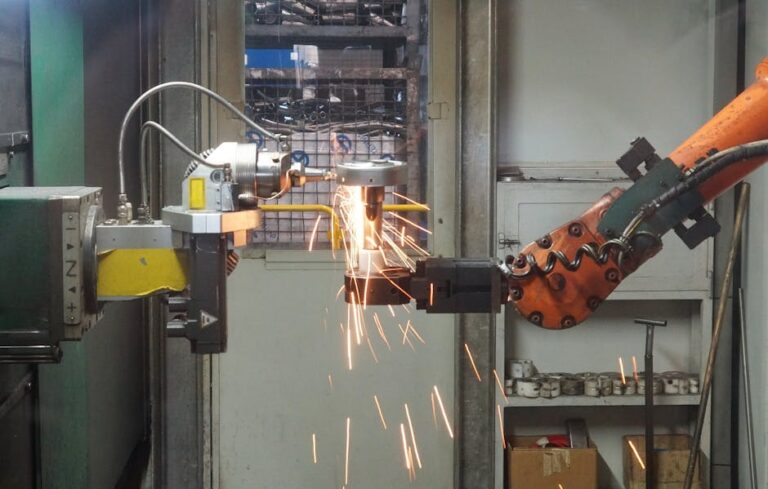
Photo by RDNE Stock project via Pexels
Defect Rates by Manufacturing Region
China manufacturing regions show some variation in typical defect rates. Coastal developed regions (Guangdong, Zhejiang, Jiangsu): generally lower defect rates (1-3%) due to mature manufacturing infrastructure, experienced workforce, and established quality systems. Interior developing regions: potentially higher defect rates (3-6%) as manufacturing develops, but improving rapidly. Region is less important than individual supplier—good suppliers exist in all regions, as do poor ones. Evaluate suppliers individually, not by region.
Factors Affecting Defect Rates
Product Complexity
More complex products have higher defect rates. Complexity factors: number of components, precision requirements, assembly steps, material variety, and testing requirements. A simple injection-molded part has fewer defect opportunities than an electronic device with 50 components. When benchmarking defect rates, compare similar products. A 5% defect rate for complex electronics may be good; the same rate for simple plastic parts would be poor.
Supplier Quality Systems
Supplier quality capability is the primary determinant of defect rate. Quality system elements: incoming material inspection, in-process quality checks, final inspection effectiveness, testing capabilities, and corrective action processes. Suppliers with ISO 9001, strong QC processes, and quality culture achieve lower defect rates. Factory audits reveal quality system maturity. A supplier’s defect rate history is the best predictor of future performance.
Order Size and Production Volume
Order size can affect defect rate. Small orders (under MOQ): may have higher defect rates as factory may deprioritize or rush. Large orders: may have lower defect rates as production stabilizes, but risk of systematic defects affecting many units. Optimal: orders that match factory’s efficient production scale. Very large orders should include during-production inspection to catch systematic issues early.
Price Pressure
Aggressive price negotiation can increase defect rates. When factories face margin pressure, they may: use cheaper materials, reduce QC steps, rush production, or cut corners on processes. The relationship between price and quality is real. Unrealistic price targets often result in higher defect rates that cost more than the price savings. Balance price negotiation with quality requirements.
Production Timing
Production timing affects defect rates. Peak periods (pre-Chinese New Year, pre-holiday): higher defect rates due to worker fatigue, production pressure, and temporary workers. Off-peak periods: generally better quality as production is less rushed. New worker training periods: higher defect rates until workers gain experience. Plan production timing when possible and increase inspection during high-risk periods.
Using Defect Rate Data
Supplier Evaluation
Use defect rate data to evaluate and compare suppliers. Track defect rates across orders for each supplier. Compare: average defect rate, defect rate trend (improving or worsening), consistency (variance between orders), and defect types (are issues consistent or random?). Set acceptable defect rate thresholds based on your requirements. Example: require under 3% for standard products, under 1% for critical products. Use data for supplier selection, growth decisions, and improvement discussions.
Quality Improvement
Defect data drives quality improvement. Process: track defects by type and frequency, identify top defect categories, analyze root causes with supplier, implement corrective actions, and verify improvement in subsequent orders. Pareto analysis: typically 80% of defects come from 20% of causes. Focus improvement efforts on top defect categories for maximum impact. Track improvement over time—defect rates should decrease with proper attention.
Cost Analysis
Calculate the cost of defects to understand impact. Direct costs: rework, replacement, returns, refunds. Indirect costs: customer dissatisfaction, reviews, lost sales, reputation damage. Example: 5% defect rate on 10,000 units = 500 defective units. If each defect costs $5 to address = $2,500 defect cost. Compare defect cost to cost of improved quality control. Often, investment in quality improvement has strong ROI.
Customer Impact
Consider defect rate from customer perspective. A 5% defect rate means 5% of customers receive defective products. For consumer products, this translates to: 5% return rate, negative reviews, customer service contacts, and lost repeat business. For B2B products, defective products damage customer relationships and may lose accounts. The customer-impacting defect rate is often higher than inspection defect rate, as some defects pass inspection but cause customer problems.
Reducing Defect Rates
Supplier Quality Development
Work with suppliers to improve their quality capability. Activities: share defect data and analysis, discuss root causes collaboratively, support corrective action implementation, provide technical assistance if possible, and recognize improvement. Many suppliers want to improve but lack resources or knowledge. A collaborative approach improves both quality and relationship. Document improvement plans and verify results.
Process Improvements
Identify and address process issues causing defects. Common improvements: better incoming material inspection, improved in-process checks, equipment maintenance and calibration, worker training, and process standardization. Work with supplier to implement improvements. Investment in process improvement pays off in reduced defect rates over time.
Design for Quality
Product design affects defect rate. Design considerations: simplify assembly, reduce precision requirements where possible, use proven materials and components, design for manufacturing (DFM), and test designs thoroughly before production. A design that’s difficult to manufacture will have higher defect rates. Involve manufacturing expertise in design decisions.
Inspection and Testing
Appropriate inspection catches defects before they reach customers. Strategies: pre-shipment inspection for every order, during-production inspection for large/critical orders, increased inspection frequency for problem suppliers, and testing for safety and regulatory compliance. Inspection doesn’t reduce defect rate—it catches defects. But inspection data enables improvement. Balance inspection cost with defect cost.
Defect Rate Benchmarks by Industry
| Industry | Typical Range | Good Performance | Key Defect Types |
|---|---|---|---|
| Consumer electronics | 3-8% | Under 3% | Function, assembly, cosmetic |
| Apparel/textiles | 2-5% | Under 2% | Stitching, fabric, sizing |
| Plastic products | 1-3% | Under 1% | Cosmetic, dimensional |
| Metal products | 2-4% | Under 2% | Finish, dimensional, assembly |
| Home goods | 2-4% | Under 2% | Cosmetic, function |
| Automotive parts | 0.5-2% | Under 0.5% | Dimensional, function |
Conclusion
Understanding defect rate benchmarks helps set realistic expectations and measure quality performance. This guide covered: industry benchmarks showing 2-5% typical, under 1% excellent performance, variation by product category with electronics higher than simple goods, factors affecting defect rates including complexity, supplier quality, and price pressure, and using defect data for supplier evaluation, improvement, and cost analysis. The key principles: benchmark against similar products, not all products; track defect rates over time for trend analysis; use data to drive improvement, not just acceptance decisions; and balance defect rate targets with cost and customer impact. A 3% defect rate that’s improving is better than 2% that’s worsening. The goal is continuous improvement, not just meeting a benchmark. Use defect rate data as a tool for supplier management and quality improvement, and your China sourcing will become more reliable over time.
Need Help Managing Quality and Defect Rates?
Top China Sourcing provides quality control services including inspection, supplier evaluation, and quality improvement programs. We help you track defect rates, identify issues, and work with suppliers on improvement. Contact us today to improve your China sourcing quality.
Last updated: April 30, 2026 | Defect Rate Guide by TCS Editorial Team
Sources
- ASQ Quality Management Statistics
- Six Sigma Quality Benchmarks
- TCS Supplier Quality Database 2026
- China Manufacturing Quality Studies
- Industry Quality Benchmark Reports